
In my introduction post and in the round table discussions, my focus was on how the constant collection of data and effects it can have on us humans. To collect data is originally a good thing that can/should help us but because of the constant collection and access to data that is not always the case. Since 2010 it’s shown that we generate more numbers and data then we have done all the way up until 2010, https://www.youtube.com/watch?v=42iP_qQqiCc&t=1515s . What does this number pandemia with us? We are not only comparing ourselves to others but also constantly to ourselves. But what does it also do to the ones that for different reasons can’t collect and also access that data?
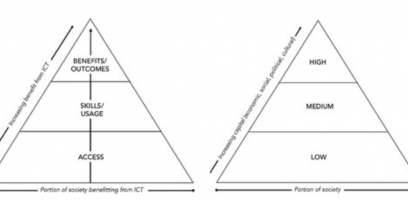
Jonathan Cinnamon writes about the question of whether data related inequalities can be explained by existing social inequalities? When viewing data more critically it has shown that it produces inequality and even harm in society. He refers to a firgure the shows that digital inequalities reflect extant social inequalities. All ‘levels’ in the figures of digital inequality are related to inequalities in economic, social, political, and/or cultural capital.
These digital inequalities in todays “data world” builds on societies that already have lack of infrastructure, human capital and economic resources and on top of that also create a dimensioned that Cinnamon refers to as the digital divide:
“a divide in the capacity to place the analytic treatment of data at the forefront of informed decision-making and, therefore, a divide in (data-based) knowledge.”
This digital divide would also sort people into ‘data-classes,’ depending on if you collected or analysed the big amount of data, or whether one was simply a passive or almost even not aware, producer of it. The majority of people would be in the later class. These great numbers of people provide big data analytics with their digital footprints. Important to realize is that these data class divisions do not necessarily map onto existing socioeconomic inequalities, but rather create new groups that are not being treated equal as the other data-class. Which makes the inequalities in data being both between countries with different technological possibilities but also within the societies and the peoples individual knowledge and understanding that not only differs within economical groups but also age and generations.
While certain groups collect data from as many objects and activities as possible like fitness trackers, sleep measures and location-based services, the data divide grows. Not only because of the lack of reliable data in countries with no or very little access to produce data but also within different generations.
For the individual, data poverty is closely associated with patterns of socioeconomic inequality, which is people that may go through life without leaving a trace in any official records, let alone a comprehensive civil registration system that tracks births, deaths, and cause of death. My fellow bloggers Talia V and Michaela write more about it in their posts. And these participation gaps produce unequal technological opportunities, but more important in this post, they create uneven representation of the world as data, which is fundamentally shaping the physical world and how we live our lives in it. Those who produce data and maybe even more the ones who analyse it, are shaped by their own worldview.
As an examples Cinnamon is mentioning Wikipedia that is produced both in and about the Global North and more privileged settings A partial and biased digital representation of the world is thus encoded in the databases of these projects, which then shapes our understanding of the world. So instead of reflecting the ‘wisdom of the crowds,’ they are more accurately the ‘situated knowledge of powerful groups.’
Hans Rosling writes in his book Factfulness how you can understand the world through data and explains that with data also comes responsibility. The world is being perceived as a scary place because what you hear has been selected, both by yourself and by the media. So what happens when only certain data is reported. He also mentions his theory, the size instinct where he describes humans tendency to get things out of proportion and misjudge the size of things. In these situations data can help and show it how it is. But here it is then important that you don’t only look at one singular number. you always need to put the data in relation to something. Otherwise it’s useless and you are back to the tendency to get things out of their proportion. So what happens then if that data isn’t representative for everyone? Not only is the data difficult to analyse but the the results are not even accurate then.
Rosling also mentioned the single perspective instinct and explains it that we humans wants to see things from one single perspective. So while we have a lot to learn and gain by looking at data we can not look at only those alone, but rather what they tell us in relationship to real lives. Beraldo and Milan writes simliar that data is defined in function of what people do with it, with emphasis on the human and political agency rather than size of the data. And when it comes to data in use of activis more often than not, deal in fact with “good enough data”—that is to say, “citizen data” generated for example through measuring and quantifying practices sufficient to provide “ways of realizing environmental and social justice.
Conclusion:
We are measuring and collecting data more than ever. And also relying on data more than ever. But at the same time and for the same reason the data divide becomes a bigger problem. The data pandemi pressure the people in it, to not only compare to each other but also to themselves in a way that creates problem. People get obsessed with performance and believes the data more then their own experiences as Dahlen and Thorbjornsen mentions in their book “Sifferdjur”. Might sound a bit confusing but for example if we measure our sleep, and wake up one morning feeling really well rested and feel that this was a good night sleep and then look at the sleep monitor that shows that it actually wasn’t a good night’s rest, studies show that people then feel more tired and question their own perception of a good night’s sleep. And there is a risk that we feel like we can never be good enough or not even succeed in sleeping. The pop culture have many examples of this scenario and how the increased rating and measuring is harmful. The series Black mirror and the episode Nosedive is an example of this.
While at the same time it is shown that the people, societies and groups that are left outside of the data collection are suffering from other problems. They are risking to not be a part of societies way of living and development. And groups that already are exposed are the one that are in highest risk. So with the production and analysing of data, and also the use of the results comes a lot of responsibilities and new leanings to constantly look for and be aware of.
Reference material:
https://journals.sagepub.com/doi/full/10.1177/2053951719885967
https://www.dn.se/kultur/hur-slappnar-man-av-i-ett-samhalle-dar-aven-vilan-ar-matbar/
https://www.tandfonline.com/doi/full/10.1080/02681102.2019.1650244?scroll=top&needAccess=true
Factfulness: Ten Reasons We’re Wrong About the World–and Why Things Are Better Than You Think, Anna Rosling Rönnlund, Hans Rosling och Ola Rosling, 2018